Baby Steps in creating a Commodities Benchmark
DeepDesk-Bench is an early proof of concept. It currently tests a very limited set of tasks, so the results should be treated as preliminary rather than a general ranking of models for commodities work.
The four-task DeepDesk-Bench dataset is available on Hugging Face🤗
My husband is really into benching, both the gym kind and the AI models kind. I got inspired and also wanted to see if it is possible to do this benchmarking thing for AI’s performance in commodities workflows.
Introducing: DeepDesk-Bench
A benchmark that tests the ability of AI to perform tasks done by on a trading desk, e.g. by a commodities analyst.
To do so, the benchmark gives AI agents realistic front-office tasks. The Agent must find and reconcile information, make defensible decisions, and work with tools like websites and spreadsheets to produce a correct and auditable deliverable.
Benchmarking is where you create an exam paper for different AI models to try to perform the same task, so you can compare the scores and rank which performed best. It's helpful because it helps you to decide which model to use for your specific purposes. e.g. if you are using an Agent, you can route specific tasks to specific models for better performance and costs savings.
What I want to measure is the performance of different agents on specific and clearly defined tasks which could contribute to PnL.
The Challenges of building an Eval for Commodities
A major challenge in building an eval on my own, is that commodities systems and data are most of the time proprietary, and public domain tasks and data aren’t really available due to the nature of the sector.
To circumvent this, I created a simulation which mimics what goes on in a commodities firm, using “pretend tasks“ and “pretend data”, put together based on my experience of how these workflows operate in practice.
I think using simulated tasks and real life environments would become the prevalent way of approaching evals in industries like finance/markets, alongside other anonymised tasks that firms might donate. In that sense, the simulated tasks themselves will become part of the value-add.
For a start, I decided to just go ahead and bench on a hypothetical SnD updating task where an analyst has to check a website for information.
An Essential but Tedious Task: Maintaining an SnD
Maintaining a SnD and keeping it updated is one of the daily tasks expected of a commodities analyst as a core tool for fundamental analysis, to quantify deficits and surpluses for commercial decisions. We look at Gas SnD as an example.
What a Gas SnD can look like:
Supply:
+ Pipelines
+ LNG Sendouts
+ Domestic Productions

Demand:
- Residential
- Power
- Industry
- Exports

Supply - Demand: Storage Injections/Withdrawal
There are many exciting factors which could move a Gas SnD:
- Freeport outage: lower US LNG exports → lower global LNG supply → fewer expected LNG receipts at destination countries, depending on cargo allocation → a different storage path in the model.
- Higher LNG demand from China: fewer flexible cargoes available to Europe → JKM may strengthen relative to TTF → Europe needs a higher TTF price to attract cargoes → lower LNG supply into Europe if prices do not rise enough.
Outside of these event driven SnD movers, there are also the constant arrivals of LNG cargoes which needs to be updated in the LNG Sendouts section of gas balances, using LNG shipping data (AIS, port calls, nominations, regas terminal notices) on a daily basis. How each firm connects their balances to LNG shipping data is different, but hypothetically, this could be where daily grunt work lies.
Updating LNG Sendouts with LNG Shipping Data
The task of updating the LNG Sendout section of a gas balance using LNG shipping data could be broken down into 3 main steps:
- Step 1: Checking the data source to identify the relevant vessels for our concerned regas terminals, respecting data cutoff standardisations.
- Step 2: Comparing the new data with the existing records in the Excel SnD, and deciding whether each cargo should be added, updated, kept, excluded, or left unresolved.
- Step 3: Updating the Excel SnD correctly.
In summary, we are assessing whether AI can update the LNG supply part of a European gas SnD from the below data:
vessel / cargo observations
+ terminal operational data
+ nominations / sendout logic
+ prior Excel gas balance
Where most of the decision making sits in Step 2.
Read on if you are interested in the commodity specific reasoning behind going from cargo records to LNG sendouts.
The physical LNG chain
A ship arriving does not immediately add gas supply to the grid. The cargo first discharges into the terminal's LNG tanks. It only enters the gas balance when the terminal regasifies the LNG and sends the gas into the pipeline system.
This is why the model keeps a discharge date and a sendout-start date. They are normally the same gas day, but a terminal outage can separate them.
How sendout is calculated
Each included discharge leg gets the terminal's standard three-day sendout profile: 20% on Day 0, 50% on Day 1, and 30% on Day 2.
A 600 GWh cargo starting sendout on 15 January therefore contributes 120 GWh on 15 January, 300 GWh on 16 January, and 180 GWh on 17 January. The three days add back to the full 600 GWh.
European gas days begin at 06:00 local terminal time. The analyst converts the UTC arrival into local time and assigns it to the gas day containing it. Unless a terminal notice says otherwise, sendout begins on that arrival gas day.
How the analyst works through the records
- Work to the cutoff. Use only records received by LNG-PortalSim by 12:00 UTC on 14 January. Ignore anything received later, even if the event happened before the cutoff.
- Check the terminal coverage. Include Dunkerque, Zeebrugge, South Hook, and Gate. Exclude Aliaga and Bilbao from the balance.
- Match existing cargoes. Use the IMO number and voyage ID to link LNG-PortalSim records to cargoes already in the book.
- Remove duplicates. If two feeds report the same vessel, voyage, event, time, and value, count them as one cargo.
- Use the strongest evidence. Prefer a current terminal nomination, followed by a confirmed port call, then the AIS destination. AIS can show that a vessel is laden, but its destination may be out of date.
- Decide what to do with each cargo. Add it, update it, confirm it, exclude it, or leave it unresolved.
- Record the details. Enter the terminal, discharge date, sendout start, total cargo energy, discharge fraction, and whether the cargo is included in the balance.
- Explain the decision. Cite the relevant LNG-PortalSim record IDs and add a short reason.
The nine cargo decisions
ALBA — add
ALBA is not in the prior book. Nomination obs-101 schedules 600 GWh at Dunkerque on 15 January, while AIS record obs-102 shows the same vessel and voyage laden and heading there. The standard sendout is 120, 300, and 180 GWh across 15–17 January.
CALYPSO — update
CALYPSO is already booked as cargo-201 for 15 January. Nomination obs-201 moves the 900 GWh Zeebrugge discharge to 17 January. The old profile must eventually be replaced by 180, 450, and 270 GWh across 17–19 January.
DELTA — exclude
DELTA was previously included at Dunkerque. Port-call record obs-301 confirms a diversion to Aliaga on 16 January. Aliaga is outside the model, so the analyst keeps the 750 GWh physical leg for audit purposes but sets include to No. It contributes no European LNG sendout.
BOREAL — confirm
An old AIS record says Southampton, but it is stale. Current nomination obs-402 confirms 600 GWh at Zeebrugge on 15 January. The nomination wins and the prior-book values stand. Its sendout remains 120, 300, and 180 GWh across 15–17 January.
EQUINOX — update into two legs
EQUINOX was previously one 1,000 GWh Dunkerque cargo. Records obs-501 and obs-502 show one voyage split across two terminals: 40% at Dunkerque on 15 January and 60% at South Hook on 17 January.
- The Dunkerque leg is 400 GWh and sends out 80, 200, and 120 GWh across 15–17 January.
- The South Hook leg is 600 GWh and sends out 120, 300, and 180 GWh across 17–19 January.
The JSON stores the 1,000 GWh cargo total on both legs and uses fractions of 0.4 and 0.6. It must not turn the legs into two separate cargoes.
FJORD — add, with delayed sendout
Nomination obs-601 schedules an 800 GWh discharge at Gate on 15 January. Notice cap-nl-20260115 reduces Gate's regasification capacity to zero for that gas day. The cargo still enters the terminal tanks on 15 January, but sendout starts on 16 January. The full profile shifts to 160, 400, and 240 GWh across 16–18 January.
MERIDIAN — add once
obs-701 and obs-702 are duplicate AIS reports from two feeds. Nomination obs-703 provides the controlling 500 GWh Dunkerque schedule. The analyst adds one cargo, producing 100, 250, and 150 GWh of sendout across 15–17 January.
GALLANT — update using the cutoff-correct record
obs-801, received at 10:01, moves the 700 GWh cargo to 16 January. A later correction, obs-802, says 15 January but was not received until 12:30. It falls outside the information cutoff and must be ignored, even though its event time is 11:55. The accepted profile is 140, 350, and 210 GWh across 16–18 January.
HELIOS — unresolved
obs-1001 nominates Dunkerque while obs-1002 nominates Zeebrugge. They are equal-priority records, and LNG-PortalSim provides no tie-break. The quantity is also given as 170,000 m³ of liquid LNG, while the model provides no conversion from liquid volume to GWh. The analyst leaves the cargo out of the numerical balance and explains both problems.
The workbook's 10.8 GWh per mcm assumption cannot solve the HELIOS case. It converts a standard volume of gaseous natural gas into energy; it is not a conversion for cubic metres of cryogenic liquid LNG.
What the decisions do to the balance
| Terminal | Included tracked energy |
|---|---|
| Dunkerque | 1,500 GWh |
| Zeebrugge | 2,200 GWh |
| South Hook | 600 GWh |
| Gate | 800 GWh |
| Total | 5,100 GWh |
The prior book contains 3,950 GWh, so the decisions add a net 1,150 GWh to January. The workbook also carries 2,200 GWh/day of base LNG sendout. That gives 68,200 GWh of base sendout plus 5,100 GWh from the tracked cargoes, or 73,300 GWh for January.
That sendout feeds total European gas supply. With demand at 635 mcm/d, the remaining gap is about 16.06 mcm/d of storage withdrawal. Task 02 does not calculate or write those spreadsheet outputs, but its cargo decisions determine them.
Setting up the Exam Paper
Models were evaluated running inside the same Pi agent.
They were provided two things:
1) a European gas balance Excel workbook
The workbook starts with the previous day’s LNG cargo schedule. The agent updates cells with the information it read from LNG-PortalSim that feeds into the sendout profile and eventually the monthly European gas balance via excel formulas, and records its updates in a log.
Download the starting Excel workbook to see the file supplied to the agent before it makes any updates.
2) a link to LNG-PortalSim: A made-up LNG data portal
A made-up web page containing synthetic data with intentional ambiguities to trip up models, including stale vessel positions, duplicate-looking records, conflicting terminal nomination information, split discharges, terminal constraints, etc.
Open LNG-PortalSim to browse the same vessel, cargo, terminal, notice, and methodology pages used in the eval.
Each of the 3 main steps involved in updating the SnD were given as independent tasks to the AI agent to be evaluated in isolation (mapped to Task 01, Task 02, Task 03) along with a new Task 04 which is defined as being the full update from Step 1 to 3.
By separately testing each of the 3 main steps, we are able to better identify which specific step an agent might struggle the most with.
Judging Criteria
The grading is deterministic. A score of 70 or more passes, unless the submission makes an automatic-fail mistake.
Scoring for Task 04: Full update
The agent must work out the cargo decisions from LNG-PortalSim before updating the workbook.
| Type | What is scored | Points | What the grader checks |
|---|---|---|---|
| Score | Operational schedule | 40 | The agent works out the cargo decisions and enters them correctly. |
| Score | Numerical gas balance | 25 | The schedule produces the correct LNG sendout, supply, demand, storage, and terminal inventory figures. |
| Score | Evidence and cutoff | 20 | The update log cites the right records and respects the cutoff. |
| Score | Workbook integrity | 10 | The formulas, links, sheets, and calculated values still work. |
| Score | Handling uncertainty | 5 | The unresolved cargo is identified, explained, and kept out of the balance. |
| Deduction | Uses evidence received after the cutoff | −15 and automatic fail | A late record is cited or used. |
| Deduction | Includes an unresolved cargo | −15 and automatic fail | The unresolved cargo is included in the balance. |
| Deduction | Counts a duplicate cargo twice | −10 | Duplicate reports create more than one included cargo. |
| Deduction | Adds an unsupported cargo | −5 each, up to −15 | A cargo without supporting evidence is included. |
| Deduction | Hardcodes the LNG result | −10 | A calculated LNG output is replaced with a fixed number. |
Results
From 11 to 14 August 2026, with the help of my husband, we ran evals across eight models and all four tasks using Pi as the agent. We used Harbor to run the benchmarks.
Harbor is an open-source framework for running and scoring AI-agent evaluations in isolated environments. Basically it ensures a standardised test environment (can think of it like a test center for AI agents)
A red outline below means the task failed. That can happen even when the numerical score is above 70% because a critical error (e.g. an unsupported cargo or a damaged workbook formula) overrides the score.
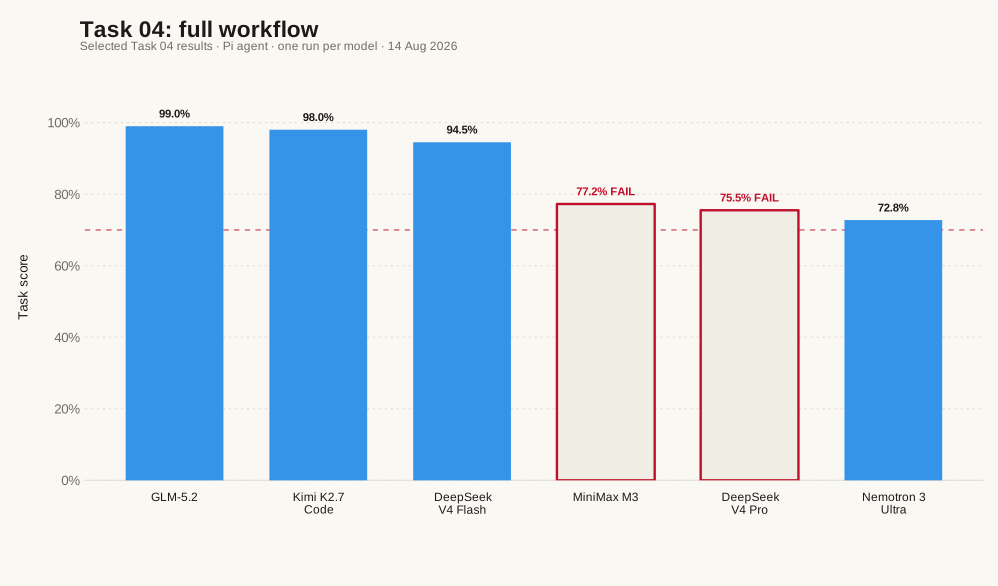
Task 04 is the end-to-end workflow. Each score comes from one run.
### Full Task-by-task Scores| Model | 01 Recon | 02 Decide | 03 Excel | 04 Full |
|---|---|---|---|---|
| GLM-5.2 | 98.3% | 97.8% | 100.0% | 99.0% |
| Kimi K2.7 Code | 93.9% | 88.6% | 100.0% | 98.0% |
| DeepSeek V4 Flash | 95.6% | 97.0% | 100.0% | 94.5% |
| MiniMax M3 | 98.3% | 90.8% | 100.0% | 77.3%Fail |
| DeepSeek V4 Pro | 98.9% | 98.4% | 100.0% | 75.5%Fail |
| Nemotron 3 Ultra | 96.7% | 93.1% | 96.8% | 72.8% |
| Gemma 4 31B | 0.0%*Fail | 0.0%*Fail | 85.3% | 62.5%Fail |
| Qwen3.6 27B | 96.7% | 93.1% | 100.0% | 0.0%*Fail |
* 0% scores by Qwen3.6 27B and Gemma 4 31B were further investigated to be caused by infrastructure issues. Qwen encountered an agent-execution failure, probably involving Qwen’s tool use or its compatibility with Pi. Gemma faced a provider failure, hitting rate limits. Both of these failures had nothing to do with the models abilities to reason or perform the commodities tasks. They were thus omitted from the ranking chart.
It is worth noting that in this campaign each task for each model was ran only once. A more reliable comparison would run every model on each task several times, then report the average score and pass rate but that would burn a lot of tokens.
Final Thoughts and Next Steps
I had a lot of fun dipping my toes into benchmarking, but setting it all up took more time and technical know-how than I expected. I also think this bench has much more room for improvement, in terms of refining the judging criteria and how it is scored (e.g. 70% = pass was an arbitrarily decided threshold, and a much stricter penalty should be given for hallucinations). I need to also create a much more robust “simulated world” with a wider breadth of situations and tasks. These are all improvements to be included in the next iteration.
A final thought is that evals are essential if we want to use AI reliably in real workflows, and they should not be limited to technical teams. If a firm wants to rapidly scale AI adoption in a structured manner, there should be some way for companies to create tools for their non-technical employees to test models on their own tasks, measure results, make improvements, etc.